Articles || Other || What's New ||
Table of Contents
 The CO2 Record in Plant Fossils
 The Ice Core Record
 The Presumption of CO2 Stability
 Basis for the Estimate of Pre-Industrial CO2
 The Last 15,000 Years-- Reconsidered
 Putting Things in Perspective
The CO2 Record
in Plant Fossils
Plant fossils obtained from
sedimentary rocks and peat deposits are a relatively new tool being used
to unravel Earth's carbon dioxide (CO2) history. Tiny pores on
plant leaves and needles called stomata regulate carbon dioxide
absorption and water vapor release. Stomata numbers decrease
during times of high atmospheric CO2,
and increase
when atmospheric CO2 is low.
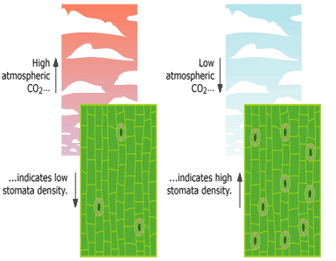 |
Nature's CO2 meter:
 A standardized way of counting stomata--
called the stomatal index ( SI [%] )-- has been found to be a good
way to estimate the CO2 content of the atmosphere when the plant
was alive. The SI-CO2 relationship varies according to plant species, habitat
altitude, and other factors. A standardized way of counting stomata--
called the stomatal index ( SI [%] )-- has been found to be a good
way to estimate the CO2 content of the atmosphere when the plant
was alive. The SI-CO2 relationship varies according to plant species, habitat
altitude, and other factors.
 Correlation charts are constructed
using modern plant specimens by determining their SI numbers and corresponding
CO2 concentrations. When SI and CO2 ranges are fully characterized for
a plant species, the charts are used as to estimate CO2 levels for related
species in the geologic past. Correlation charts are constructed
using modern plant specimens by determining their SI numbers and corresponding
CO2 concentrations. When SI and CO2 ranges are fully characterized for
a plant species, the charts are used as to estimate CO2 levels for related
species in the geologic past.
 To determine plant age Carbon14 methods are usually used to about
40,000 years ago. For older material, other dating methods are used. To determine plant age Carbon14 methods are usually used to about
40,000 years ago. For older material, other dating methods are used.
|
| Image courtesy of: UC Berkeley; The
story in the stomata |
Because plant stomata numbers do not change after the
leaves or needles fall from the parent plant, they make a good indicator
or proxy of atmospheric CO2 in Earth's past. What they show
is that the popular belief that CO2 levels prior to the Industrial Revolution
were a steady 280 ppm (parts per million) may be incorrect.
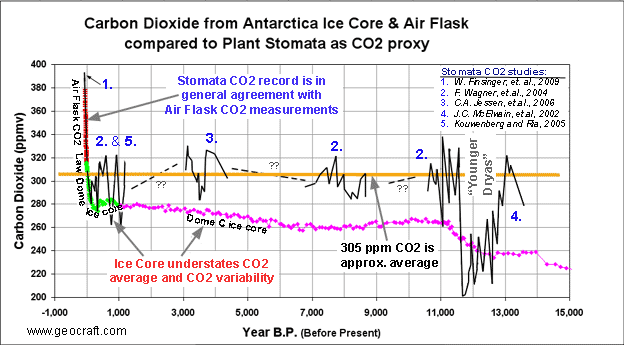
As illustrated below, studies of stomata for recent and fossilized plants
show that atmospheric CO2 levels over the last 15,000 years have been higher
and much more variable than previously supposed. Much of what we think
we know about CO2 levels of the past 800,000 years is based on the ice
core record.
 |
| Recent
stomata
studies
show that CO2 was more variable and the average
CO2 concentrations have been significantly higher during our Holocene
interglacial period (last 11,000 years) than are indicated by the ice
core record.
Read
below for more details. |
The Ice Core
Record
Ice cores obtained by drilling
into permantent ice caps in Antarctica and Greenland have been the most
important way to determine past levels of carbon dioxide-- however,
recent stomata studies show that the ice core record may be misleading
in several important respects.
For example, when ice cores are crushed to extract the gases from trapped
air bubbles to determine CO2 content, there is an assumption made that
ice bubbles preserve an accurate record of the Earths CO2 history. However,
the chemical composition of ice bubbles undergo changes that may distort
this record.
 Accumulating ice layers can take a century or
more to become buried deep enough to be isolated from the atmosphere, which
at the South Pole occurs at a depth of approximately 120 m. The resulting
heat and pressure causes gas exchange between ice layers, which modifies
the chemistry of ice air bubbles. At burial depths of between 900 and 1200
meters the pressure is so great that air bubbles in ice disappear and the
gases recombine with liquids and ice crystals. Such processes tend to smooth
away variability in the ice record and may also make CO2 levels appear
lower than they really were, obscuring much of the resolution pertaining
to CO2 variability (1-4).
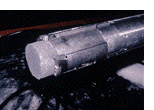
ice core photo by: Vin Morgan
Palaeo
Environment (Ice Cores) Field Work 
 "Liquid water is common
in polar snow and ice, even at temperatures as low as -72C, (and) in cold
water, CO2 is 70 times more soluble than nitrogen and 30 times more soluble
than oxygen-- guaranteeing that the proportions of the various gases that
remain in the trapped, ancient air will change. Moreover, under the extreme
pressure that deep ice is subjected to -- 320 bars, or more than 300 times
normal atmospheric pressure -- high levels of CO2 get squeezed out of ancient
air."
Zbigniew Jaworowski (8)
expert in the atmospheric deposition of radioactive contaminants
in glacial ice
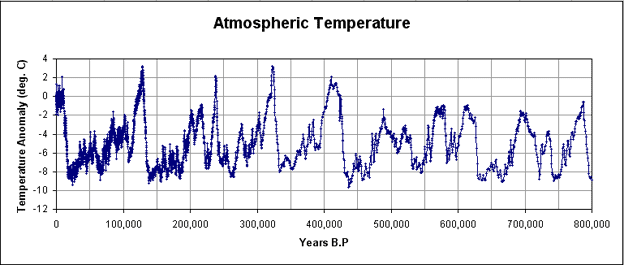
Figure 1. (ref. 22)
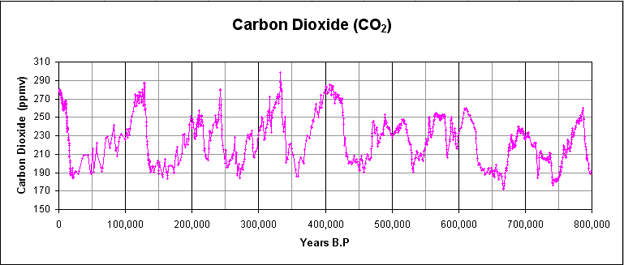
Figure 2. (ref. 22)
Although the ice core record represents a very nice overall view of
temperature and CO2 trends over many thousands of years,
their reliability for resolving details over timescales of decades-- or
in some cases several centuries-- is limited. Nonethess, these data are
used as the principle evidence to show that CO2 levels in excess of 300
parts per million are unprecedented in all of human history and a cause
for concern.
The Presumption
of CO2 Stability
The records of CO2 and Temperature
over the last 15,000 years (but without the stomata CO2 record)
appear in Figure 3. Except for the South
Pole Air Flask CO2 measurements, all other data shown (including
temperature) are from ice cores.
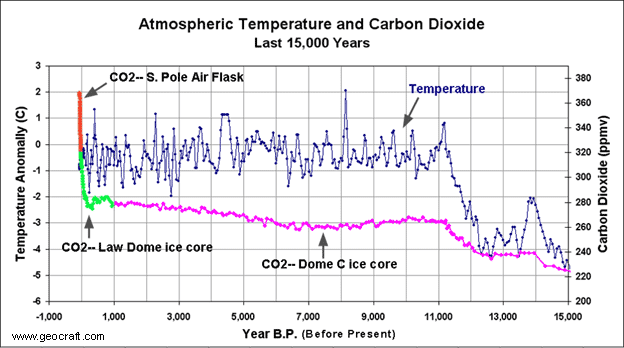 |
| Figure
3.
The CO2 record for the past 15,000 is comprised of ice cores, mostly. These
came from Law
Dome
and Dome
C
in Antarctica. Since 1957 the CO2 record at the South Pole has been by
analyzing Air
Flask
samples. (see larger image).
By convention, "Years B.P." (Before Present) begins 1950 AD,
which is why later years are "negative." |
.
According to the Dome C and Law Dome ice cores, for nearly 15,000 years
prior to the Industrial Revolution CO2 has remained below 280
ppm (parts per million), while only the youngest part of the
Law Dome cores (after 1900 AD) show
CO2 concentrations higher than 300 ppm.
The youngest CO2 data, is not based on ice cores but on South Pole Air Flask samples-- which consistently show
CO2 higher than 300 ppm. The point in time useful for considering
what CO2 concetrations really were before humans started to burn fossil
fuels is at the start of the Industrial Revolution-- about 1750
AD. A key assumption is that pre-Industrial CO2 concentrations were
less than 280 ppm and that everything above that is caused by humans. This
assumption, however, is not without problems, although seldom discussed.
Basis for
the Estimate of Pre-Industrial CO2
 The
Industrial Revolution started in Europe in the mid 1700's. The time
before is referred to as "Pre-Industrial" time.
Because reliable CO2 air tests were not being performed until the 1800's,
the presumed CO2 concentration in 1750 is 280 ppm, based largely on ice
core data and early work by G.S. Callendar.
In the 1800's direct air CO2 measurements were performed by various
researchers. Interestingly, the CO2 levels reported by them were mostly
in excess of 300 ppm. For reasons that are unclear, only a few of
these tests were considered valid by G.S. Calendar (1898-1964)-- the grandfather
of the theory of man-made global warming. Today, the remaining data are
largely ignored, although a few commentators like E. Beck and Z. Jaworoski
suggest the data--some compiled by Nobel Prize laureates-- are generally
valid and were inappropriately dismissed (4, 21) .
Callendar claimed humans had increased CO2 concentrations in the atmosphere
by burning fossil fuels, and had thereby changed the atmosphere from 274
ppmv to 325 ppmv by 1935-- resulting in a 18.3 percent increase which had
caused the global surface temperature to rise 0.33 deg. C (5).
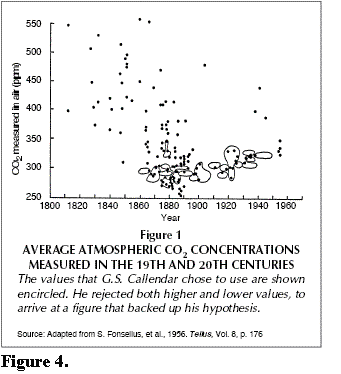
However, CO2 data available at the time showed concentrations ranged between
250 ppm and 550 ppm (Figure 4). Callendar has been accused of cherry-picking
data from a sampling of 19th century averages, using 26 that supported
his ideas, but rejecting 16 that were higher than his assumed low global
average, and 2 that were lower (6).
Despite numerous 19th century air measurements showing +300 ppm CO2
levels, and despite the fact that many of the youngest ice cores showed
higher than expected CO2 values and so were shifted forward 90-100 years
from previously-established dates so that they would match the more elevated
CO2 levels of 20th century air samples, the ice core record is today generally
used to represent pre-1957 CO2 concentrations. The Intergovernmental Panel
on Climate Change (IPCC) places the pre-industrial concentration of CO2
in the atmosphere at 280 ppm, based largely on the ice core record, although
this has never been otherwise substantiated (7).
When systematic air readings began in 1957 AD, CO2 air values were about
315 ppm. Today, CO2 concentrations are about 384 ppm. Current
estimates of the anthropogenic (man-made) component of atmospheric CO2
range between 4% (9) and 25% (the latter
assumes Pre-Industrial levels were 280 ppm, and assumes everything
over that today is man-made). The problem with the 280 ppm baseline figure
is that increasing evidence suggests this figure may be too low.
CO2 levels exceeding 300 ppm, we are told, are unnatural and
unprecedented, but available 19th century CO2 air data and studies of plant
stomata suggest another side to the story.
| Fiction: |
|  "The recent
rate of change is dramatic and unprecedented; increases in CO2 never exceeded
30 ppm in 1 kyr – yet now CO2 has risen by 30 ppm in just the last
17 years. " "The recent
rate of change is dramatic and unprecedented; increases in CO2 never exceeded
30 ppm in 1 kyr – yet now CO2 has risen by 30 ppm in just the last
17 years. "
Intergovernmental Panel on Climate Change (IPCC)
Working
Group I: The Physical Science Basis of Climate Change
 4th
Assessment Report, 2007 4th
Assessment Report, 2007
|
| Fiction: |
|  "At no point
in the last 650,000 years before the pre-industrial era did the CO2 concentrations
go above 300 part per million..." "At no point
in the last 650,000 years before the pre-industrial era did the CO2 concentrations
go above 300 part per million..."
from, An Inconvenient Truth
by,
former Vice President Al Gore
(now, chairman and
co-founder of Generation Investment Management--
a
London-based business that sells carbon credits)
|
| Fact: |
|  "The majority
of the stomatal frequency-based estimates of CO2 for the Holocene do not
support the widely accepted concept of comparably stable CO2 concentrations
throughout the past 11,500 years." "The majority
of the stomatal frequency-based estimates of CO2 for the Holocene do not
support the widely accepted concept of comparably stable CO2 concentrations
throughout the past 11,500 years."
F. Wagner, et.al., 2004
Paleoecologist
and stomata research scientist (13)
|
The Last 15,000
Years-- Reconsidered
Studies of plant stomata
show that the currently-held view of predominantly stable CO2 levels (260-280
ppm) before the Industrial Revolution (1750 AD, i.e. 200 years B.P.)
may be an inaccurate view. CO2 levels appear to have regularly exceeded
280 ppm-- the average of CO2 concentrations across the Holocene
interglacial period (last 11,000 years) appears to have been approximately
305 ppm (see ref. 10-20).
Contrary to the prevailing notion of CO2 stability,
CO2 swings of 20-50 ppm or more over timespans of 500-1000 years appear
to be the norm-- not the exception.
 |
| Figure
5.
Illustrated here are results from recent stomata studies which show
that CO2 was more variable and the average
CO2 concentrations have been significantly higher during our Holocene
interglacial period (last 11,000 years) than are indicated by the ice
core record. A precipitous
drop in CO2 during the "Younger Dryas" was captured nicely by
the stomata record, but missed by the CO2 record in ice cores. (larger image). |
Stomata researchers regard the plant stomata proxy as a reliable means
to measure CO2 levels in the geologic past, including the Holocene interglacial
period, which spans the period from about 12,000 years ago and continues
to the present.
 "Stomatal data increasingly
substantiate a much more dynamic Holocene CO2 evolution than suggested
by ice core data "
L. Kouwenberg, et.al. 2005 (9)
Laboratory of Palaeobotany and Palynology, Utrecht University,
Netherlands
Data from various stomata studies (ref. 10-20)
show CO2 concentrations over the last 11,000 years varied between 260
and 340 ppm (average: 305 ppm). In contrast, the Dome
C ice core record shows no significant variability and considerably
lower overall CO2 levels (average: 270 ppm).
A sharp CO2 decline is indicated between 11,500 to 12,800 B.P., coinciding
with an abrupt cooling phase, known as the "Younger Dryas" (Figure
5 ). While this event is obscured in the Antarctic Dome
C ice core CO2 record, it shows up clearly in the stomata CO2
record.
Based on these stomata data, the conventional Pre-Industrial baseline
of 280 ppm may be understated by about 25 ppm. In other words, 24% of the
presumed 105 ppm Industrial Era CO2 increase may in fact be a result of
bias and poor resolution of CO2 variability in the ice cores.
While the stomata data show higher values of CO2 than do pre-1900 ice
data, they generally agree with the very youngest part of the Law Dome ice data (1900-1957 AD) and also with
the contemporary S. Pole Air Flask
CO2 record (actual air samples) begun in 1957 and continuing today. In
other words, stomata results agree with the data that are least susceptible
to distortion and diffusion errors.
The stomata record offers important evidence to challenge the notion
that variations in CO2 levels of 20-50 ppm over timespans of less than
1000-years are "unprecedented" or that Pre-Industrial CO2 concentrations
never went above 300 ppm-- both may, in fact, have been normal.
Putting Things
in Perspective
New studies of plant
stomata add important information about natural CO2 variations in Earth's
atmosphere. Such studies show that natural variations in CO2 are more dramatic
than we have been led to believe, and that CO2 levels which regularly rise
past 300 ppm may be the norm-- not the exception-- during the last 11,000
years. Natural CO2 levels up to 340 ppm are suggested during this time,
challenging claims that 300 ppm represents a CO2 threshold which is both
"unprecedented" and un-natural in our recent climate history.
In reality, the actual amount of human additions to CO2 over the past
250 years is more of an academic issue than a practical one, as the theory
that human additions to atmospheric CO2 are the principle driver of Earth's
temperature changes, has not been proven. For example:
 The notion that CO2 drives temperature
is disproved
by the ice core record,
 which shows that temperatures rise first, then CO2 follows
later.
 While CO2 has risen steadily over
the last decade, global surface temperatures
have not increased.
 Temperatures in the mid troposphere
(5 km up), where signals of greenhouse warming should be strongest, have
actually
declined since 2000.
According to greenhouse theory, this should not be happening if CO2 increases
are the primary cause of global warming.
 As the case for a CO2 problem looks
increasingly uncertain it is appropriate to question climate projections
and computer models on global warming to ensure that we are not basing
important and expensive decisions on information that currently may be
no more meaningful than answers given by a magic 8-ball.
Given the many complexities of clouds, ocean sinks, cosmic influences,
and historical uncertainties, it is clear that our understanding of CO2
levels and climate cycles is incomplete. A new piece to this puzzle comes
from simple plant fossils, which hold important clues about Earth's
dynamic climate past-- and future.
Return to Carboniferous
Climate
Articles
|| Other || What's New
|| Table of Contents
Created: January 24, 2010
References:
1) Digging
for Ancient Air at South Pole; Todd Sowers, In Depth (newsletter
of the National Ice Core Laboratory), vol. 4, issue 1, Spring 2009.
2) CO2 diffusion in polar ice: observations from naturally formed
CO2 spikes in the Siple Dome (Antarctica) ice core; Jinho Ahn, Melissa
Headly, Martin Wahlen, Edward J. Brook, Paul A. Mayewski, Kendrick C. Taylor;
Journal of Glaciology, Vol. 54, No. 187, 2008. 
3) Everyone
is entitled to their own opinion but not their own facts; Tom Quirk,
A presentation to The Lavoisier Group Workshop: ‘Rehabilitating Carbon
Dioxide,’ held in Melbourne, Australia, June 29-30, 2007)
4) Another
Global Warming Fraud Exposed: Ice Core Data Show No Carbon Dioxide Increase;
Zbigniew Jaworowski, Ph.D., 21st Century, pp 42-52, Spring 1997.
5) Ibid.
6) Ibid.
7) Ibid.
8)
The ice-core man "Once upon a time, and for millennia before
then, carbon dioxide levels in the atmosphere were low and stable...";
by Lawrence Solomon for National Post, May 23, 2007; re-printed
by canada.com.
9) The distribution
of CO2 between atmosphere, hydrosphere, and lithosphere; minimal influence
from anthropogenic CO2 on the global "Greenhouse Effect";
Tom V. Segalstad; Mineralogical-Geological Museum, University of Oslo,
Norway
10) Atmospheric
CO2 fluctuations during the last millennium reconstructed by stomatal frequency
analysis of Tsuga heterophylla needles; Lenny Kouwenberg, Rike
Wagner, Wolfram Kurschner, Henk Visscher; Geology, January 2005.
11) The Preboreal climate reversal and a subsequent solar-force climate
shift; J. van der Plicht, B. van Geel, S.J.P. Bohnche, J.A.A. Box,
M. Blaauw, A.O.M. Speranza, R. Muscheler, and S. Bjorck; Journal of Quaternary
Science (2004) 19(3), pp. 263-269.
12) Rapid
atmospheric CO2 changes associated with the 8,200-years-B.P. cooling event;
Friederike Wagner, Bent Aaby, and Henk Visscher; PNAS, September 17, 2002;
vol. 99, no.19, pp. 12011-12014.
13) Reproducibility
of Holocene atmosphere CO2 records based on stomatal frequency;
Friederike Wagner, Lenny L.R. Kouwenberg, Thomas B. van Hoof, Henk Visscher;
Quaternary Science Reviews 23 (2004), pp.1947-1954.
14) Stomatal
evidence for a decline in atmospheric CO2 concentrtion during the Younger
Dryas stadial: a comparison with Antarctic ice core records; J.C.
McElwain, F.E. Mayle, and D.J. Beerling; Journal of Quaternary Science
(2002), 17(1), pp. 21-29.
15) Early
Holocene Atmospheric CO2 Concentrations; Technical Comments; Science,
vol. 286, December 3, 1999
16) Stomatal-based
inference models for reconstruction of atmospheric CO2 concentration: a
method assessment using a calibration and validation approach;
W. Finsinger and F. Wagner-Cremer; The Holocene, 19,5 (2009), pp. 757-764.
17) Last
interglacial atmospheric CO2 changes from stomatal index data and their
relation to climatic variations; Mats Rundgren, Svante Bjorck,
Dan Hammarlund; Global and Planetary Change 49 (2005), pp. 47-62.
18) Stomatal
frequency adjustment of four conifer species to historical changes to atmospheric
CO2; Lenny L. R. Kouwenberg, Jennifer C. McElwain, Wolfram M. Kürschner,
Friederike Wagner, David J. Beerling, Francis E. Mayle and Henk Visscher;
American Journal of Botany. 2003; 90: pp.610-619.
19) CO2
radiative forcing during the HoloceneThermal Maximum revealed by stomatal
frequency of Iberian oak leaves; I. Garc´ýa-Amorena,
F. Wagner-Cremer, F. Gomez Manzaneque, T. B. van Hoof, S. Garc´ýa
A´ lvarez, and H. Visscher; Biogeosciences Discuss., 5, 3945–3964,
2008.
20) Abrupt
climatic changes and an unstable transition into a late Holocene Thermal
Decline: a multiproxy lacustrine record from southern Sweden; Catherine
A. Jessen, Mats Rundgren, Svane Bjorck, and Dan Hammarlund; Journal of
Quaternary Science (2005), 20(4), pp. 349-362.
21) 180 Years of Atmospheric CO2 Gas Analysis by Chemical Methods;
Ernst-Georg Beck; Reprinted from Energy & Environment, vol 18,
no. 2, 2007. 
22) The Ice Core Record:
Graphs of Temperature (Figure 1) and Carbon Dioxide (Figure
2) were created using Micosoft Excel and published data from the following
sources.
Carbon Dioxide
South Pole Air Flask (1957-2006 AD)
Atmospheric CO2 concentrations (ppmv) derived from flask samples collected
at South Pole, Antarctica
L.P. Steele, P.B. Krummel, R.L.
Langenfelds
Atmospheric, Research, Commonwealth, Scientific,
and Industrial Research Organization, Australia
August 2007
Law Dome ice core (1006-1954 AD)
Historical CO2 record from the Law Dome DE08, DE08-2, and DSS ice cores
D.M. Eheridge
L.P. Steele
R.K.
Langenfelds
R.J. Francey
Division of Atmospheric
Research, CSIRO, Aspendael, Victoria, Australia
J.M. Barnola
Laboratoire of Glaciologie et Geophysique de l'Environnement,
Saint Martin d'Heres-Cedex, France
V.I Morgan
Antarctic CRC and Australian Division, Hobart, Tasmania, Australia
Dome C ice core (1000-22,015 years B.P.)
Monnin, et.al., (2001)
University of Bern
Temperature
Radiosonde- Troposphere and L. Stratosphere (1979-2008 AD)
Surface-100 mb dataset (Global)
J.K Angell
Air Resources Laboratory
National Oceanographic and
Atmospheric Administration (NOAA), 2009
S. Hemisphere Ground (1871-1978 AD)
S.HEMI Land-Ocean Temperature Index in 0.01 degrees Celsius base period:
1951-1980
sources: GHCN 1880-12/2009 + SST: 1880-11/1981
HadISST1 12/1981-12/2009 Reynolds v2 using elimination of outliers and
homogeneity adjustment
Notes: 1950 DJF = Dec 1949 - Feb
1950
Vostok Ice Core (1812 AD -422,766 years B.P.)
Historical Isotopic Temperature Record from the Vostok Ice Core
The data available from CDIAC represent a major effort by researchers
from France, Russia, and the U.S.A. Jouzel, J., C. Lorius, J.R. Petit,
C. Genthon, N.I. Barkov,
V.M. Kotlyakov, and V.M. Petrov. 1987. Vostok ice core: a continuous
sotope temperature record over the last climatic cycle (160,000 years).
Nature 329:403-8.
Jouzel, J., N.I. Barkov, J.M. Barnola, M. Bender, J. Chappellaz,C. Genthon,
V.M. Kotlyakov, V. Lipenkov, C. Lorius, J.R. Petit,D. Raynaud, G. Raisbeck,
C. Ritz, T. Sowers, M. Stievenard, F. Yiou, and P. Yiou. 1993.
Extending the Vostok ice-core record of palaeoclimate to the penultimate
glacial period. Nature 364:407-12
Jouzel, J., C. Waelbroeck, B. Malaize, M. Bender, J.R. Petit, M. Stievenard,
N.I. Barkov, J.M. Barnola, T. King, V.M. Kotlyakov,V. Lipenkov, C. Lorius,
D. Raynaud, C. Ritz, and T. Sowers. 1996.
Climatic interpretation of the recently extended Vostok ice records.
Climate Dynamics 12:513-521.
Petit, J.R., J. Jouzel, D. Raynaud, N.I. Barkov, J.-M. Barnola, I. Basile,
M. Bender, J. Chappellaz, M. Davis, G. Delayque, M. Delmotte, V.M. Kotlyakov,
M. Legrand, V.Y. Lipenkov, C. Lorius, L. Pepin, C. Ritz, E. Saltzman, and
M. Stievenard. 1999.
Climate and atmospheric history of the past 420,000 years from the Vostok
ice core, Antarctica. Nature 399: 429-436.
Source: J. R. Petit, D. Raynaud, C. Lorius
Laboratoire de Glaciologie et de Geophysique de l'Environnement
38402 Saint Martin d'Heres Cedex, France
J. Jouzel, G. Delaygue
Laboratoire des Sciences du Climat et de l'Environment
(UMR
CEA/CNRS 1572)
91191 Gif-sur-Yvette Cedex, France
N. I. Barkov
Arctic and Antarctic Research Institute
Beringa Street
38
St. Petersburg 199397, Russia
V. M. Kotlyakov
Institute of Geography
Staromonetny, per 29, Moscow 109017,
Russia
January 2000